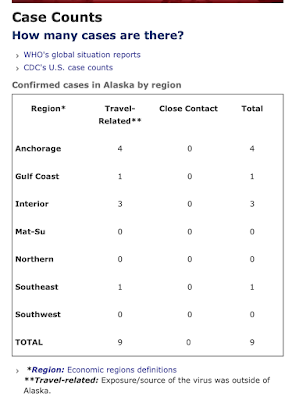
- 3 new positive tests (two more were reported after the report was posted)
- New category - 'Community Contact' is now 'Non-Travel'
- Date was added - wasn't there yesterday
The second part is structured the same as yesterday. Some observations:
- The earlier reports distinguished between new positive and new negative tests. The chart above doesn't show when the positives (confirmed) tests happened, only where.
- The charts below don't distinguish between the cumulative positive and negative tests or the daily positive or negative tests
- So, there's no way to figure out how new positive (confirmed) tests are increasing over time, unless you have made screen charts of the previous days' announcements
- Which is more or less why I started these posts and created my own table to track the daily changes in tests and daily changes in cumulative results
- The cumulative chart (below) shows a line, but there are only actual numbers on the last day, so you have to estimate for the other numbers
- The daily tests chart (further below) doesn't even have numbers for the last day, so you have to guess those numbers as well. You can get reasonably close, but these are numbers they have and we shouldn't have to approximate.
- Before yesterday, the reports distinguished between completed confirmed and negative tests. They don't do that any more. I'm assuming that the confirmed are now part of the total number of tests given.
However, today's graphs (below) present a new challenge for me. The numbers don't add up right for me. I still have a low grade fever and a cough and so maybe I'm just not concentrating hard enough, but this isn't high level math.
When I use their numbers in the first chart, the cumulative totals
- for State Tests (529) plus
- the commercial tests (169)
- adds up to 698 total tests since they started testing.
Going back to yesterday's post* we see there were 513 total tests. So subtracting
- yesterday's total 513
- from today's total of 698
- tells you that there were 185 more tests since yesterday
But when you go down to the next graph and add the numbers it comes out differently
- the blue line showing number of state tests posted today (for yesterday) we get something close to 75 - we have to guesstimate because the actual number isn't listed
- and the red line showing the number of commercial tests is just about 55
- 75+55 = 130
- which is 55 less than what the top chart (compared to yesterday's posted totals) comes to
- and even if you add or subtract a few digits because you're guessing off a graph, it's still significant
*(I have to send you to my blog post on this because the state's count page for yesterday has been replaced with today's (Friday) So you can't go back there. Fortunately I've been posting screenshots.)
But that leaves me with a difficulty in putting the correct numbers in my cumulative chart. I've done my best.
Alaska Covid-19 Data by Steve on Scribd
I understand that the Governor drastically cut state employees last year. On top of that the people left are struggling with a massive disaster like the state has never seen. It takes experience and time to figure out the most important numbers to report and how to report them and the state is clearly figuring this out while facing a zillion other tasks.
My intent here originally was to simply document the numbers as they changed day-to-day since that wasn't possible if you just looked at the daily reports (which replaced the previous days' reports.) I'm doing the best that I can and appreciate any suggestions readers might have to do it better. Or to let me know if someone else is doing this elsewhere.
https://docs.google.com/spreadsheets/u/2/d/e/2PACX-1vRwAqp96T9sYYq2-i7Tj0pvTf6XVHjDSMIKBdZHXiCGGdNC0ypEU9NbngS8mxea55JuCFuua1MUeOj5/pubhtml# has been trying to track each state daily, but it would appear that Alaska's changing formats has, for the moment anyway, messed up their scraping system. The latest they have for Alaska is a total of 6 positive and 402 negative for a total of 408 tests.
If you go to the State tab, you'll see this comment for Alaska:
"Unclear if their reported number means "persons tested" or "specimens tested." We count them as "persons tested" because the header indicates this is the case. Negatives reported on site have decreased at various times in recent hours, without explanation."


