[Scroll down to see theWEEKLY STATE UPDATES/CHARTS (latest date on top). Beginning part is a bit of history of my tracking COVID.]
I've had a chart showing COVID data from the main Alaska COVID dashboards since before there were even dashboards. I started when they were simply posting daily updates and it was difficult if not impossible to see the previous days' totals. You couldn't tell if things were getting better or not. Over time the data presentation got better with more previous data available too. But the numbers they said for yesterday or last week weren't always the same as what they originally said.
COVID reporting slowed to three times a week, then once a week, then once a month.
In October the COVID dashboards were 'archived.' In their place they now offer charts showing total new cases of Respiratory Viruses: RSV, Flu, and COVID.
My first response was to put them up on the old page (as Blogspot calls tabs), but it makes more sense to start a new one for this. I even considered letting folks check for themselves, but I've discovered that the numbers listed in each column (when you put the cursor over it) are not the same numbers in that week's column the previous week. I assume it's because they get late submissions etc. but I'll try to make it easy to see the weekly differences and changes in the data.
Here's the link to the last COVID tab (May 2021-October 2023)
Here's the link to the 2nd COVID tab (October 2020 - April 2021)
Here's the link to the 1st COVID tab (June 2020 - September 2020) The chart on this one goes back to when I started: March 11, 2020, when the numbers were first reported.
I will probably start a new chart to make it easier to track the numbers. Easier, that is, than comparing weekly graphs.
Link to Alaska Dept of Health Respiratory Virus Snapshot. That's where these charts below came from.
WEEKLY STATE UPDATES/CHARTS (when available)
April 5, 2022 - There's no new post because when I clicked my link to the State website with the charts I've been using I got:

I used the search, but I couldn't find the updated chart. I sent an email to the web person as they suggested I'm still waiting to hear. If anyone knows where the chart went, please let me know.
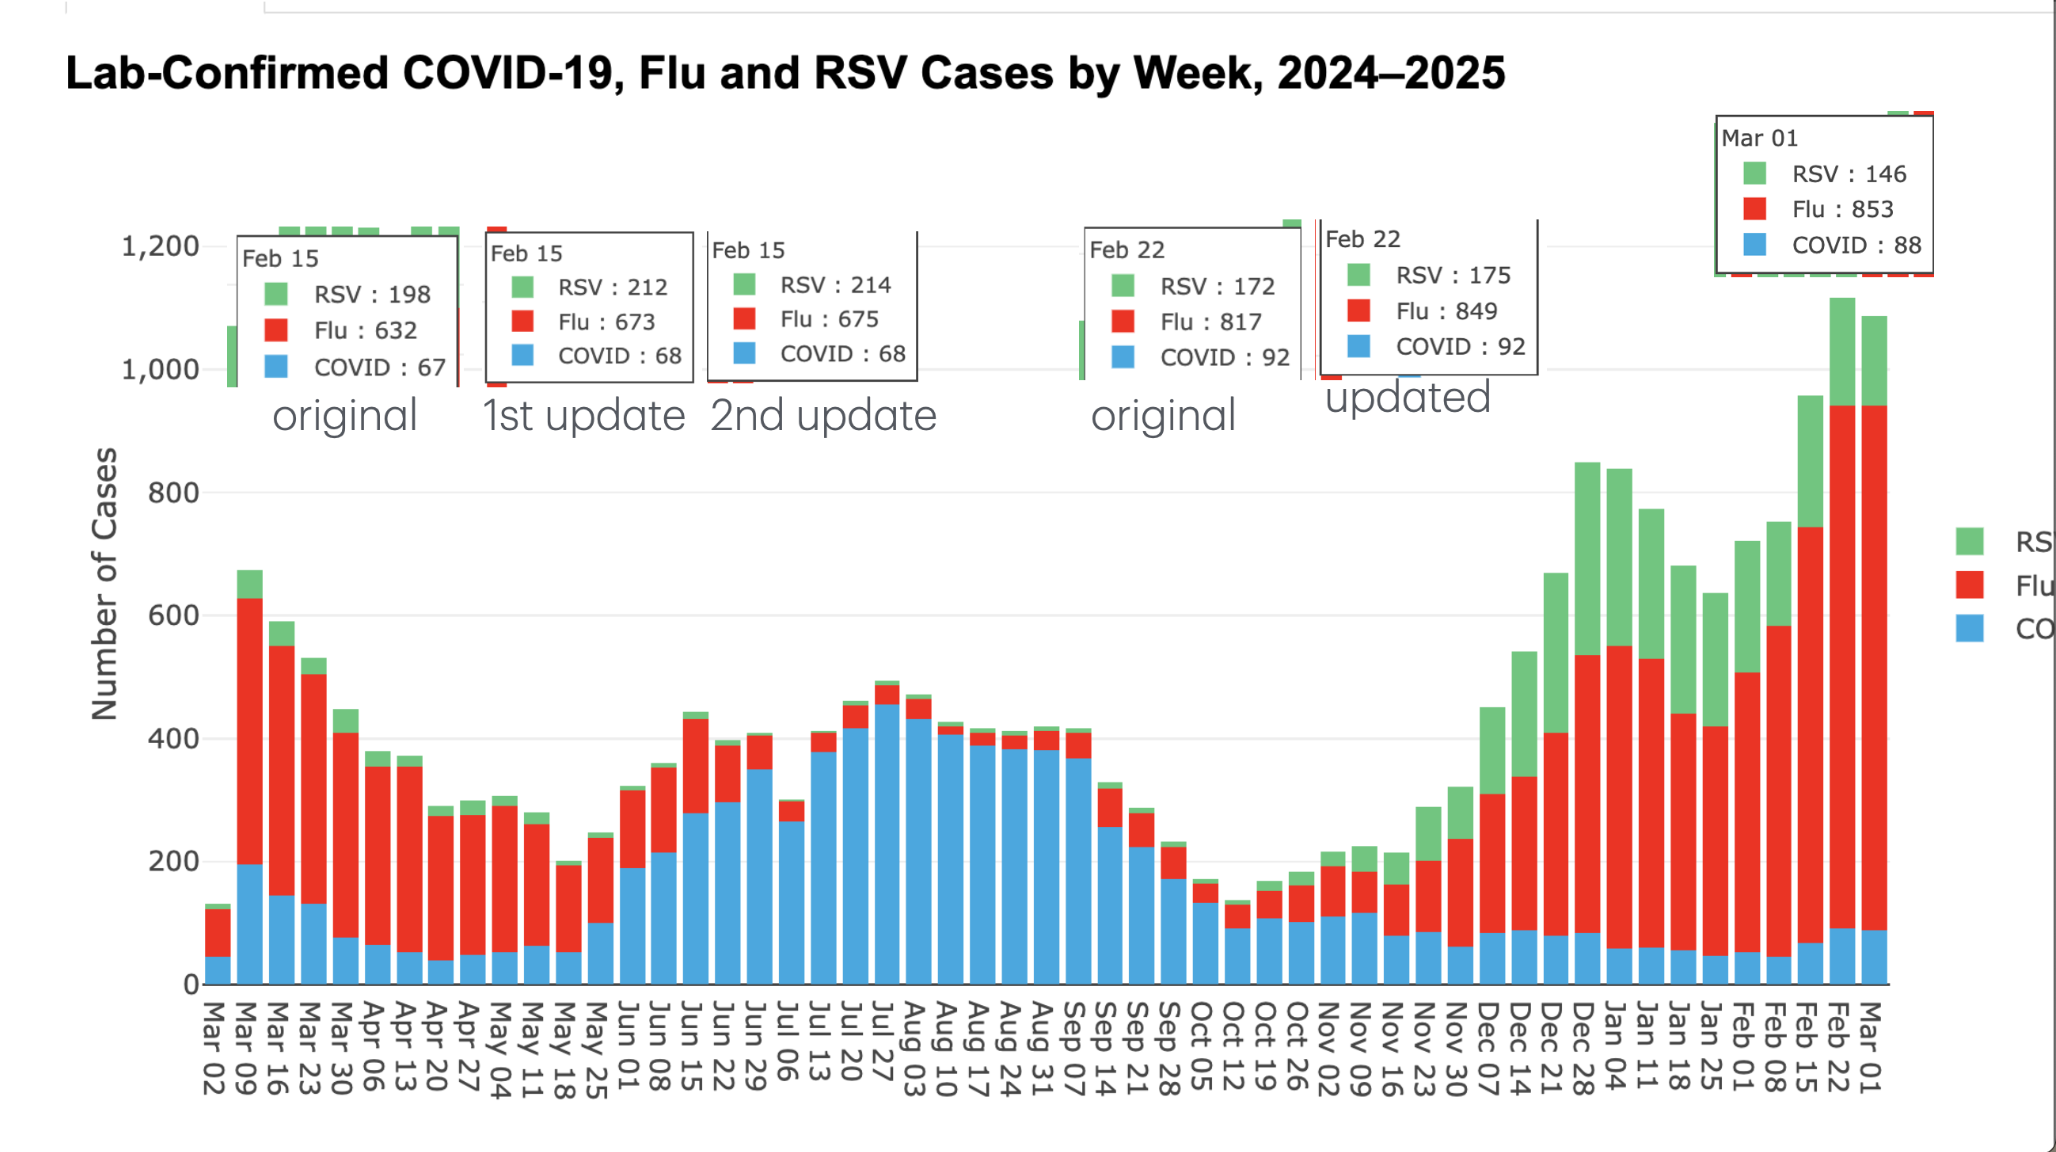
March 26, 2025 - Numbers heading down. I'll try to add a bit more comment, but putting up the chart with the recent number updates for now.
Updated 3/28/25 - I've added labels to the chart. You can see that March 8's 2nd update increased the total from 1051 (last week's update) to 1096. Last week still looks like a sharp drop. This week is a little lower, but it may pass March 8 when the March 15 updates come in.
Flu continues to be the major virus followed by RSV. COVID is at a low level. It was 23 a year ago, then surged in July and August and started falling in September and has been below 100 since November 16, 2024 until the previous two weeks - March 8 and 15.

March 16, 2025 - The new numbers have been up a few days, but I'm only getting to this now.
1. As I predicted last week, the updated total for the three viruses tracked for March 1, put March 1 as the highest since the State has been posting these numbers. While March 1 was initially lower (1087) than February 22 updated number (1116), this week March 1 updated (1197) surpassed February 22 (2nd update of 1132) comfortably (well not so comfortably for the people who have gotten sick). I'd note that the February 15 numbers were updated a second time (for a total of three different outcomes) and went up by 8. But I'm not going to track these that closely.
2. The total for the three viruses is down by just about 200. So I'm guessing this week will stay lower than last week, even with updated numbers.
RSV dropped by 52 - from 153 to 103.
Flu dropped by 147 - from 948 to 801
Covid rose 2l, from 94 to 96.
But remember I'm comparing updated numbers (last week) to original numbers (this week). So, while dropping is good, with next week's update, the differences won't be as big.
MEASLES
Since Measles is in the news, I thought I'd check what the State website had on measles. The most recent is from January. It mentions one case and then follows with several pages of information on measles. (I did check - measles is a singular noun, so it's "measles is" NOT "measles are.")
"Case Report
A measles case was confirmed in a resident of the Southern Kenai Peninsula this week. This person is an unvaccinated adult who began experiencing symptoms while traveling home to Alaska from a trip overseas. This person was infectious while flying on Alaska Air flight 228 from Seattle to Anchorage on January 10 and while at the Ted Stevens Anchorage International Airport from approximately 10PM January 10 to 12AM January 11. Nonimmune persons who were near the infected person on the airplane or in the airport could be at risk for developing measles.
The person then drove from Anchorage to the Southern Kenai Peninsula and remained at home except for seeking healthcare.
The person sought care and was immediately isolated upon arrival at the South Peninsula Hospital Emergency Department on January 13; clinical specimens were obtained for measles testing. The patient was transferred in isolation to Providence Alaska Medical Center on January 14 and maintained in isolation during hospitalization. Polymerase chain reaction (PCR) testing at the Alaska State Virology Laboratory was positive for measles RNA virus on January15."
There is still a federal CDC page which gets updated weekly on measles. It says:
"Measles cases in 2025
As of March 13, 2025, a total of 301 confirmed* measles cases were reported by 15 jurisdictions: Alaska, California, Florida, Georgia, Kentucky, Maryland, New Jersey, New Mexico, New York City, New York State, Pennsylvania, Rhode Island, Texas, Vermont, and Washington. Find more real-time updates of measles cases reported by:
Texas Department of State Health Services
New Mexico Department of Health
There have been 3 outbreaks (defined as 3 or more related cases) reported in 2025, and 93% of cases (280 of 301) are outbreak-associated. For comparison, 16 outbreaks were reported during 2024 and 69% of cases (198 of 285) were outbreak-associated."
*NOTE: CDC is aware of probable measles cases being reported by jurisdictions. However, the data on this page only includes confirmed cases.
I'm guessing Alaska has only had that single identified case, even though we keep being mentioned as one of the states affected by the recent measles outbreak.
March 5, 2025 - OK, now I know for sure the updates are weekly again.
At first sight, it looks like the numbers dipped slightly this week. But not really. The original numbers for February 22 totaled 1081 (see Feb 22 original on chart). The March 1 number totals 1087, and it is more than likely to go up next week. It could get higher than the updated Feb 22 number. What we know from these numbers.
RSV cases dropped by almost 35
Flu rose a lot from the original Feb 22 number, slightly from the updated numbers
COVID dropped slightly (4 cases). For COVID, the original and updated Feb 22 numbers are the same
If the March 1 updated numbers increase when updated next week as much as the Feb 22 numbers did, March 1, 2025 will be the highest count since this particular chart began in August 2023.
- I'd note that this blog page gives you two advantages over the State's page.
- Here we go back to when this chart was first posted - August 2023. The state chart got bigger and bigger and the individual columns smaller and smaller. Eventually they started cutting off the oldest columns.
- Here I show differences between when data were first reported and then updated. The state chart just shows each week's numbers once. I don't show all the updates, because that wasn't available when the state only updated monthly. Then I could only show the updated data for the last week of each month.
- The state's chart is interactive, while mine is not. Here's a link to state chart.
February 27, 2025 - These are the highest numbers since they switched from just looking at COVID to looking at three Respiratory Viruses - COVID, Flu, and RSV. Last week was the highest count since January 2024 and November 4, 2023. You can't go back that far on the State's chart, but you can if you scroll down this page. [A key reason I started this and the COVID pages was that the State number disappeared and you couldn't easily track the trends.]
Last week I realized the State had started updating more frequently than once a month again. It looks like the updates are now weekly. That's much better than the monthly gaps. This allows us to see how the numbers change with each weekly update. So I have the last three weeks twice - the original numbers and the updated numbers.
This chart goes through February 22 and the total numbers are up once again, over 1000 this time. 1081 to be exact. But if you look at how the previous numbers rose from the original posting to the updating posting, I'd guess we'll come close to 1100 with next week's update. That will mark this as the highest number since these charts replaced the COVID charts.
This week RSV is down from 212 (the updated #) to 172 (which will go up when updated.) Flu is up from 673 (updated) to 817 this week. COVID is up from 68 (updated) to 92 this week.

realize these charts are getting a little complicated, but I'm trying to track numbers that disappear on the State charts. The advantage of the state charts is they're interactive. The disadvantage is that the previous weeks show the updated numbers, but you can't see the differences between the originally posted numbers and the updated numbers. But you can see that here. At least for the weeks where I could determine that. When they updated monthly, I could only show the changes for the last week of the month. But now that they are showing weekly changes, I should be able to track the changes better.
Wearing a mask in crowded indoor settings reduces the chances of you catching a respiratory virus, which could save you a few sick days to serious illness, and for a few people, death. People in Asia have been wearing masks for decades, particularly in Japan. Hong Kong, Japan, and South Korea are the top three countries for life expectancy. The US ranks 48th!
February 19, 2025 - On a whim, I looked at the Alaska Respiratory Virus Cases chart today, and lo and behold, it was updated to February 15, 2025. I've been updating monthly because that's when the State was posting, but they seem to be posting more frequently now. Maybe they've been doing this a while and I missed it because they'd gone to monthly. I'll check again soon to see if they are now posting weekly.
The total for the three diseases they measure is 897 cases. That's the highest total since January 27, 2024 when the original total was 936 cases, but was updated the next week to over 1000. But at that time COVID had by far the most cases. Prior to that, on Nov 4, 2023 the original total was 980 and the updated count was over 1000, again, predominantly COVID.
This time Flu is the main culprit (632 cases) followed by RSV (198 cases) and COVID is way behind (67 cases). But I'd note that most COVID tests are probably done at home and not reported to the state.
When the Feb 15 numbers are updated, if they follow the past pattern, the numbers will be higher, but I don't know if they'll break 1000. This appears to be the highest flu count since COVID.
Masks also prevent flu and RSV, so if you're in crowded places, consider a mask.

February 4, 2025 - January brought us new high levels - but of flu and RSV with COVID numbers way down. The last two weeks of January numbers dipped somewhat. Again, the COVID numbers are probably low because people can test at home and not report the results.
The online chart is interactive. Put your cursor on a column and it gives you specific numbers for that week. I've made screenshots of each week for the month. I also added the screenshot for Dec 28 from the December chart so you could see how much the numbers were adjusted from the original numbers posted at the beginning of January. I can only do that for the last week of the month because they only post these charts monthly now.
| Dec 28 first report | Dec 28 updated | |
|---|---|---|
| RSV 287 | 320 | |
| Flu 425 | 453 | |
| COVID 53 | 83 |
Presumably, the middle weeks all have updated data, but Jan 25 numbers, which are first being reported in this chart, will probably increase just as the Dec 28 numbers have
Flu highs of 493 and 467 on January 4 and 11, are the highest flu numbers we've seen. The previous high were 432 and 406 on March 9 and 16 of 2024. The RSV totals of 320 and 311 on (revised) Dec 28 and Jan 4 eclipse every previous high. Before December 2024, the highest RSV count was 86 on Feb 3, 2024.


January 5, 2025 - It's a new year.
First, comparing the numbers reported for Nov 30 originally, and now. Pretty stable. In the past COVID numbers changed a lot when reported after a week (or month). RSV and Flu are tested by medical personal. COVID can be tested at home, so many cases are probably never reported.
| NOV 30 first report | Nov 30 updated | |
|---|---|---|
| RSV | 85 | 85 |
| Flu | 175 | 176 |
| COVID | 55 | 56 |
The image from the State Website summarizes - COVID relatively low, while RSV and influenza increasing.
I'll add, the latest RSV number (Dec. 28) of 287 was the highest count ever in Alaska. Most of December counts were the highest. Dec. 7 was 141, just shy of the high of 143 on January 6, 2024. But last year, the numbers went down after that. This year they've gone up significantly each week.
Flu has also gone up significantly each week in December 2024, ending with a high of 425 on December 28, the second highest number. The highest was March 9, 2024 when it was 432. But then it dropped. In December it's gone up each week.

So get your shots while they are still readily available.
December 4, 2024 - Flu and RSV cases rise while COVID cases dip.
COVID numbers tend to increase the most from the first time reported to the updated report. But the October 26 numbers were pretty steady. (The other dates we can't compare because they now report monthly, so it's only on the last reported date - at the end of the month - that we can see the changes.)
This is the first time I recall (and the chart seems to confirm) that RSV cases are higher than COVID cases. I did check, and the CDC is not recommending, at this time, that people get a second RSV shot.
| OCT 26 first report | OCT 26 updated | ||
|---|---|---|---|
| RSV |
| 23 | |
| Flu | 58 | 58 | |
| COVID | 92 | 93 |

November 4, 2024 - The numbers dipped a bit further the first two weeks of October, but then started to climb again. Still low, but going in the wrong direction.
COVID saw the fewest cases (91) on October 13 since May 18, 2024 (52).
Flu numbers were down to 32 cases on October 5, but then started back up to 58 on October 26.
RSV was down to 3 cases on October 5, but up to 23 on October 23, the highest since April 6, 2024 (25)
Remember that the most recent week's numbers historically go up the next time they're reported (presumably as late reports come in.) The last of last month's weeks was September 28. Here's the bump from when first reported to this recent update. (Since they report monthly now, we only see the updated numbers for the other weeks.) But we can expect a bump again in the Oct 26 numbers when the next month numbers are posted.
| Sept 28 first report |
Sept 28 updated |
|
|---|---|---|
| RSV | 8 | 8 |
| Flu | 42 | 58 |
| COVID | 159 | 171 |

October 4, 2024 - The September numbers were finally up today when I looked. COVID numbers are steadily declining. It was 375 in these latest numbers for August 31 and it went down, step by step, to 159 in the September 28 listing. But the September 28 will be higher when they update in next month's chart. Also, most people seem to test at home and not report to the state unless they get real sick.
34 flu cases were reported on August 31. The number went up (to 62) over the month and back down to 42.
There were 2 RSV cases reported August 31. Over the month the number climbed to 11 cases and ends with the last report of 8.

All in all, this was a good report. This is the lowest number of COVID cases since May 2024. But right after that, in May, the numbers went right back up.
September 6, 2024 - Reasonably good news. The new charts are finally up. (Not sure what was the exact date they went up, but within the last couple of days.) The state has added updated numbers for August 3, and for the first time posts numbers for August 10, 17, 24, and 31.
Because the state puts them up monthly now (apparently) we can't see how the numbers for a particular week change. We can only see that for the last number they post each month. Last month it was August 3.
The numbers were (first numbers) and the updated numbers we see on the new chart (second number). RSV and Flu didn't change. COVID went up by 100 cases
RSV 5 - 5
Flu 34 - 34
COVID 375 - 475
However, in the last month RSV cases were below 5 each week. Flu went down, then came back up. From a high (Aug 3) of 34 down to 16 (Aug 10) and up to 28 (Aug 31)
COVID went down all month. From 475 (Aug 3) to 329 cases (Aug 31), though I'm assuming the Aug 31 number will be higher when next reported.

August 30, 2024 - No updates since the August 9 post. However, a CDC chart on COVID levels based on wastewater tests says that COVID levels are high in Alaska.

August 9, 2024 - They've finally updated the charts. Four weeks of new data.
1. Flu and RSV numbers are relatively low
2. The COVID numbers have gone up each week, then dipped in the August 3 numbers - but when they update this next, the August 3 numbers will probably be higher than the July 27 numbers. If I'm right, the numbers are still going up and the dip is only temporary - until the get more reports. That's consistent with national trends. And this does not include home tests that never get reported to the state. (To be clear, some home tests may get reported if people get sick enough.)
The chart on the State Dashboard is interactive.* When your cursor is on the column above a date, a little box pops up with the numbers. I've taken screenshots of the new four boxes and put them on the chart below.
*Remember that whenever they update the chart, the most recent numbers are likely to be different than in previous charts.

You can see that the numbers have steadily gone up since the low of April 20, 2024 when there were only 40 COVID cases reported. On July 27 there were 417 cases reported - a tenfold increase. The latest number shows a dip to 373. But when it's updated it will probably be above 417. Why do I think that?
If you look at July 6 as posted on July 12, there were 219 COVID cases posted (See the July 12 posted chart below.) But if you look at July 6 in the chart just posted, the COVID number is up to 263, an increase of 44. An increase of 44 for this week's number would get us back up to 417. But this week's number is more than 100 greater than July 6, so I expect it will go up by more than 44.
 |
| Numbers as posted Aug 8, 2024 |

I'd point out that the July 27 number is the highest number (417) since Feb 17 when there were 433 cases reported.
Since then, the number dipped to a low of 40 on April 20, as mentioned above and has steadily climbed since.Most folks who have been vaccinated or have had COVID probably won't end up in the hospital, but it will be unpleasant for most folks. People are still being hospitalized with COVID and even dying. I wore my mask yesterday at an indoor meeting. It's sort of like wearing a seatbelt, though the odds of being with someone who has COVID are probably higher than the odds of getting into a crash at the moment. (Someone might challenge me on that one, but remember there are all the people who self tested positive as well, and the people with COVID who haven't tested, so the number well beyond 400 people with COVID.)
Not sure why the State is updating the numbers every four weeks (this time) instead of weekly as earlier. I'm going to assume it's not to hide the increase, but more likely reflects being short staffed. But I don't know.
August 5, 2024 - The last time I posted was July 12, a bit over three weeks ago. The last date the state posted numbers for was July 6 - just under a month ago. Meanwhile a lot of people are getting COVID, but in Alaska we aren't finding out because the State has cut back on how often they update the numbers. To clarify, the post weekly updates, but they don't post them weekly. They post two or three weeks at a time.
As of today, there are four unreported weeks.
Meanwhile, from the LA Times (I think this link isn't pay walled):
"COVID surge’s tenacity surprises experts
Doctors, others say infections have been strong this summer, with KP.3.1.1 subvariant the most common.
BY RONG-GONG LIN II
California’s summer COVID surge has proved to be particularly strong and enduring, surprising experts with its tenacity as it storms into a third month.
The strength of this summer’s COVID surge probably is largely related to the ever-more infectious subvariants that continue to emerge as the coronavirus evolves, said Dr. Elizabeth Hudson, regional chief of infectious disease at Kaiser Permanente Southern California.
A dizzying number of related subvariants — collectively dubbed FLiRT — have emerged in recent months. One in particular, KP.3.1.1, has been picking up steam at a startling pace and has become the most common strain nationwide."
July 12, 2024 - I keep checking for new numbers. They were up today. Were they up yesterday, I'm not sure I looked yesterday, though I try to look each day. There were two new weeks worth of numbers - June 29 and July 6. I've been going back to see whether the previous week's numbers have changed from when they were first reported. Since June 8, 15, and 22 were all first reported on June 26, I went back to check what the chart says for those dates for all three diseases.
June 8: RSV - no change - 5 cases; Flu from 138 to 139; COVID from 198 to 204
June 15: RSV- no change 12 cases; Flu from 143 to 149; COVID from 237 to 258
June 22: RSV- no change-10 cases; Flu from 83 to 92; COVID from 238 to 257
So, the first three weeks of June, RSV doubled, but the numbers were low (5, 12, and 10) but didn't change after the original report.
Flu went up from the first to second week - 139 to 149 - then dropped to 92
COVID went up from 204 to 258 then dipped slightly to 257.
The two new dates first reported today were June 29 and July 6.
June 29: RSV dropped to 2; Flu dropped to 54; COVID jumped to 303
July 6: RSV 1; Flu 23; COVID dropped to 219

June 26, 2024 - Includes June 8, June 15, and June 22 numbers. They hadn't put up any numbers since June 6 when the posted the data for June 1. Basically RSV is low but increasing. Flu went up, then dropped in the most recent count. But when this week's numbers are updated, I'm guessing there won't still be a drop. COVID, which on June 1 had doubled, has kept increasing.
But, remember. The chart online is interactive and will show the numbers for each week. But almost always the numbers that show for the previous week are higher than they were when they were first posted (as new data comes in.) So 1) we don't know what the original numbers were for June 8 and 15, and 2) the numbers for June 22 will surely increase when the next update is posted. Also given that we got three weeks in one new post, I can't show you the increases for those previous weeks.
BUT, COVID is increasing in the Lower 48 and people might consider carrying a mask around and putting it on when inside with strangers. People have gone off Pandemic mode and think this is past us. I get that. We saw an episode on Resident on Netflix which took place during peak COVID, and it was truly disturbing as it brought back the feelings of helplessness we felt in the days when refrigerated trucks were used as makeshift morgues.
As people go back to normal, COVID keeps finding hosts and keeps mutating. Eventually, one will be a serious killer again. Which is not to say people aren't dying of COVID now.
 |
| Current from CDC - you can also see by state |

June 18, 2024 - There has been no update on the State's Respiratory Virus Snapshot page since the June 1, 2023 numbers went up.
June 6, 2024 - COVID jumps, flu is up, and RSV is down to one case from what was reported last week. But with the updated numbers for last week (5/25/24), flu declined slightly. But then the trend has been for the updated numbers that will be posted next week, flu will be up higher than today's 131 cases.
We were down to 40 reported COVID cases in the April 20, 2023 report, but were moving back up at a pretty good clip. It's the highest since the March 9 (three months ago) report of 193 cases. Time to consider masks again if you're in a crowded inside location.
| 5/25/24 as of 6/1/24 | 5/25/24 as of 6/6/24 | 6/1/24 as of 6/6/24 | |
|---|---|---|---|
| RSV | 7 | 7 | 1 |
| Flu | 113 | 135 | 131 |
| COVID | 77 | 86 | 172 |

June 1, 2024 - COVID cases moving back up. RSV same at 7. Flu down.
As you can see below, the COVID number reported for 5/18/24 last week was 24. The updated figure for that same date reported this week was almost double that at 46. And the 5/25/24 COVID number reported this week is 77. It would appear that will be corrected upward next week.
| 5/18/24 as of 5/18/24 | 5/18/24 as of 6/1/24 | 5/25/24 as of 6/1/24 | |
|---|---|---|---|
| RSV | 7 | 7 | 7 |
| Flu | 99 | 131 | 113 |
| COVID | 24 | 46 | 77 |

May 24, 2024 - Trying to make sense of the numbers.
1. RSV dropped by over 50% from previous week and updated reports (which were the same -17)
2. Flu - dropped by over 50% from original previous week report (220). BUT, the updated report for last week's flu numbers dropped from 220 to 165. But today's number is still a big drop even from the adjusted number.
3. COVID - Also dropped from last week's reported 48 (which was corrected this week to 55) to this week's reported 34.
| 5/11/24 as of 5/18/24 | 5/11/24 as of 5/18/24 | 5/18/24 as of 5/24/24 | |
|---|---|---|---|
| RSV | 17 | 17 | 7 |
| Flu | 220 | 165 | 99 |
| COVID | 48 | 55 | 34 |

If I read this study correctly, it says in planes before vaccines, the longer the flight, the more likely you were to get COVID, but if you wore a mask you were ok.
May 18, 2024 - The May 11 bar is lower, because flu dropped, but RSV and COVID climbed slightly. I'd note that the reported RSV cases for last week, posted this week, are lower than what was originally posted last week. [I'd note that some of my own numbers were typos and I think I've corrected them.]
An LA Times article today is titled, "Despite its ‘nothingburger’ reputation, COVID-19 remains deadlier than the flu." Just for some perspective.
Also, we don't know what's going to happen with bird flu. Not much I hope.
| 5/04/24 as of 5/11/24 | 5/04/24 as of 5/18/24 | 5/11/24 as of 5/18/24 | |
|---|---|---|---|
| RSV | 17 | 15 | 17 |
| Flu | 220 | 165 | 220 |
| COVID | 48 | 52 | 48 |
The COVID numbers are quite low compared to most of the reports for the last three years. I'm

May 11, 2024 - All numbers were up today from last week. RSV up 3. Flu up 38. COVID up 8. That is if you compare this week's numbers to what was posted last week. With the updated numbers that were posted this week with the new numbers, RSV is up 3, Flu is up 11, and COVID is down one. Confused?
The State revises the previous week's number each week, from what they posted the week before. That's why I post these tables so you can compare what was posted last week to what was posted this week.
| 4/27/24 as of 5/1/24 | 4/20/24 as of 5/1/24 | 5/04/24 as of 5/11/24 | |
|---|---|---|---|
| RSV | 24 | 24 | 27 |
| Flu | 182 | 209 | 220 |
| COVID | 40 | 49 | 48 |
The COVID numbers are quite low compared to most of the reports for the last three years. I'm guessing that's because:
- many people test at home and don't report positive tests unless they get really sick
- people who get seriously sick tend to be folks who haven't been vaccinated
- anecdotally, I hear about people with second and third rounds of COVID, and some with long COVID
I haven't felt that things are serious enough to try to find out from the state if those guesses are accurate. But we do not know how many Alaskans get hospitalized for COVID, how many die, and what those people's vaccination status is.
I wear my mask less often. I've been volunteering in a school and I wear the mask there. But that's because kids bring all sorts infections to school. If the mask keeps me from getting even a cold, it's worth it.

May 1, 2024 - RSV and COVID cases are up. Flu is down, but still far more cases than the other two diseases. Last week, the updated numbers were almost the same as the previous week - one more Flu case was the only change.
This week while last week's RSV numbers stayed the same, both Flu and COVID were updated upwards from the original report. Flu from 197 to 216. COVID from 21 to 26.
COVID has been dropping weekly since a recent high of 746 cases on January 6, 2024. Today's number, while much lower, was the first uptick since then. From 26 last week to 40 this week. I'm guessing lots of people brought COVID back to Alaska after the holiday break in December.
| 4/20/24 as of 4/18/24 | 4/20/24 as of 5/1/24 | 4/27/24 as of 5/1/24 | |
|---|---|---|---|
| RSV | 16 | 16 | 24 |
| Flu | 197 | 216 | 182 |
| COVID | 21 | 26 | 40 |

April 25, 2024 - COVID positive tests down to 21 for the week. This number hasn't been this low since the early days of the pandemic in 2020 (when the numbers were daily numbers, not weekly.) A big drop from the previous week's 48, which itself was one of the lowest numbers since the beginning.
I've been tracking not only the current week's numbers, but also the previous week's original reported number and the updated number on the following week's chart. There have always been fairly large adjustments. This week the only difference is one extra Flu case. RSV and COVID number were unchanged. Usually all three diseases have adjustments, some of them significant. I'm not sure why this trend has changed.
But, again, remember these are "Lab-confirmed cases." and don't reflect home testing of COVID or sick people who were not tested for flu or RSV.
| 4/13/24 as of 4/11/24 | 4/13/24 as of 4/18/24 | 4/20/24 as of 4/18/24 | |
|---|---|---|---|
| RSV | 17 | 17 | 16 |
| Flu | 296 | 297 | 197 |
| COVID | 48 | 48 | 21 |
These are great numbers - especially for COVID.
Is this because of vaccination? From what I can tell, more older people have gotten flu shots than RSV and updated COVID shots.
"studies show that these vaccines are effective at protecting older adults from severe disease outcomes, including hospitalization and death." (from Scientific American April 19, 2024)
But that's protection of older adults against severe outcomes. And the flu numbers are much higher than RSV and COVID, even though (according to the same Scientific American article) more people have gotten flu vaccines than the RSV or updated COVID shots.
The RSV vaccinations were new last year and ctual tests of the effectiveness of the RSV vaccination (beyond the original clinical testing) face difficulty. From an April 11, 2024 JAMA article:
"Observational studies of real-world immunization effectiveness typically compare the frequency of the illness outcome among persons who were immunized vs those who were not (cohort design) or the frequency of immunization among persons with the illness outcome vs those without the outcome (case-control or test-negative design). In both approaches, uptake of the immunization in the population must be sufficiently high to allow for an effectiveness evaluation. Immunization and outcome status also must be accurately identified. In addition, differences in the characteristics of immunized and unimmunized persons that might be associated with risk of the illness outcome must be addressed in analyses to optimize validity. "

April 18, 2024 - Flu is up, RSV and COVID are down. All three diseases updated number from last week were up today from when they were first posted last week. Even so, RSV and COVID are down from the original numbers and those posted this week. Flu is is up by 50 cases using last week's posted numbers. Only by 11 cases using the updated numbers that were posted today.
Let's assume all three numbers posted today will be up when they are updated next week.
| 4/06/24 as of 4/11/24 | 4/06/24 as of 4/18/24 | 4/13/24 as of 4/18/24 | |
|---|---|---|---|
| RSV | 22 | 26 | 17 |
| Flu | 246 | 285 | 296 |
| COVID | 60 | 63 | 48 |
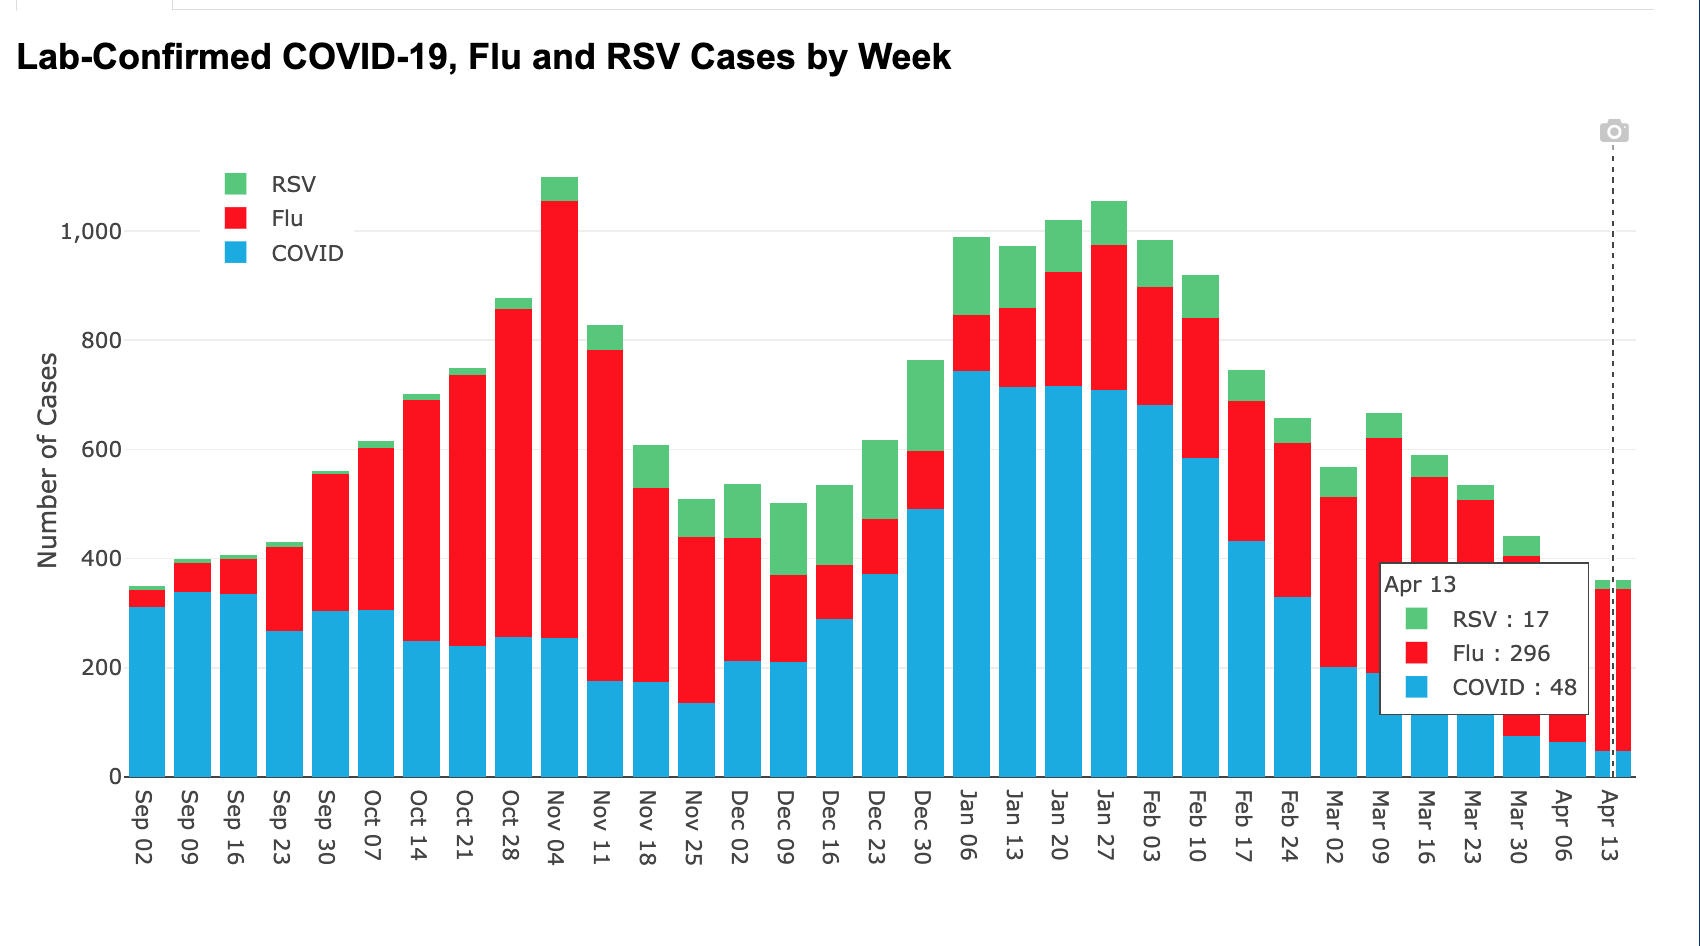
April 11, 2024 - Numbers continue to drop. All three (RSV, Flu, COVID) dropped whether you compare them to March 30 numbers posted last week or updated today. Also remember that most COVID cases are probably home tested and not reported unless they get fairly bad.
| 3/30/24 as of 4/04/24 | 3/30/24 as of 4/11/24 | 4/06/24 as of 4/11/24 | |
|---|---|---|---|
| RSV | 37 | 38 | 22 |
| Flu | 286 | 322 | 246 |
| COVID | 68 | 73 | 60 |

April 4, 2024 - Numbers keep dropping. Positive COVID tests fell below 100 per week for the first time since early in the pandemic - June 2020. That's good news. RSV is up this week from 26 last week (both in the original and the update) to 37 this week.
Flu down from last weeks revised number of 366 (it had been 330) to 286.
COVID down almost 50% from revised number of 123 (had been 119) to 68. That's the lowest number since they changed to reporting the three Respiratory Viruses last September. But I've also checked the older files. In June 2020 we were starting to get daily positive tests over 10 regularly. Weekly numbers above 100 started about the second week of June 2020.
That's a big deal. Even if most people are testing using home kits.
| 3/23/24 as of 4/04/24 | 3/23/24 as of 4/04/24 | 3/30/24 as of 4/04/24 | |
|---|---|---|---|
| RSV | 26 | 26 | 37 |
| Flu | 330 | 366 | 286 |
| COVID | 119 | 123 | 68 |

March 27, 2024 - The numbers are up now.
Remember as you look at the State's graph with the green/red/blue bars, that the most recent column (on the far right) is the first draft of the numbers. All the others are the updated numbers. Next week, the far right number (March 23 this week), will be higher when it is the second on the right. The tables I've been adding each week show the change in 'last week's' numbers and preserve 'this week's' first draft numbers.
All that said all the numbers this week are down from last week's original numbers and updated numbers. And last week's updated numbers, though higher than they originally were, are still down from the previous week.
| 3/16/24 as of 3/22/24 | 3/16/24 as of 3/27/24 | 3/23/24 as of 3/27/24 | |
|---|---|---|---|
| RSV | 37 | 39 | 26 |
| Flu | 362 | 378 | 330 |
| COVID | 138 | 144 | 119 |

March 25, 2024 - I was wondering why I got the March 16 update (below) six days late. Today I looked for the - presumably - March 23 update. Nothing new. It used to be that the COVID updates were posted on the date on the chart.
March 22, 2024 - Here are the numbers as of March 16.
If you look at the state's chart - see below - the positive tests have dropped for all three diseases. But did they really? Actually, yes. Even comparing these initial set of numbers for March 16 with the original set of numbers for March 9, there's a drop in all three diseases. But will there be a drop when we get the updated numbers for March 16? We'll have to wait and see. But this looks good.
| 3/09/24 as of 3/12/24 | 3/09/24 as of 3/22/24 | 3/16/24 as of 3/22/24 | |
|---|---|---|---|
| RSV | 48 | 43 | 37 |
| Flu | 378 | 396 | 362 |
| COVID | 179 | 179 | 138 |

March 14, 2024
If this looks pretty quick after the previous post, it's because that one was very late.
As you can see from the table, the March 2 numbers went up from the originally reported:
- RSV up from 41 to 53. So, based on the original numbers, the RSV went up 7 to 48. But based on the updated numbers, down 5. But that drop will disappear (most likely) when the March 9 numbers are updated.
- Flu up from 278 to 295 and then up this week to 378. Again the 378 will probably higher when it's update next week.
- COVID doesn't make sense to me - the adjusted numbers dropped from 317 to 182 and then this week dropped again to 179. Perhaps they discovered that one or two reports were counted twice and so it dropped when they took the double count out. But that's just a wild guess
| 3/02/24 as of 3/12/24 | 3/02/24 as of 3/12/24 | 3/09/24 as of 3/12/24 | |
|---|---|---|---|
| RSV | 41 | 53 | 48 |
| Flu | 278 | 295 | 378 |
| COVID | 317 | 182 | 179 |

March 12, 2024
We were traveling last week and when I looked for the new numbers, they were on March 2, 2024 and I thought I'd already done that one. But I hadn't, so I'm getting it up late. But fortunately the new one isn't up yet so I can capture the original data posted March 2.
The table shows the numbers as originally reported for 2/24/2024 (37) and then the corrected numbers as of 3/02/2023 (41). As of the corrected numbers, positive tests are up seven.
RSV is was originally 37 on 2/24, corrected to 41, and this week's number is up seven to 48.
Flu was 266, corrected to 278, and this March 2 is the same - 278.
COVID was 271, corrected to 317. March 2 it is down considerably to 179. But I'm guessing most COVID tests are home tests, so this number is very probably undercounted.
| 2/24/24 as of 2/24/23 | 2/24/24 as of 3/02/24 | 3/12/24 as of 3/02/24 | |
|---|---|---|---|
| RSV | 37 | 41 | 48 |
| Flu | 266 | 278 | 278 |
| COVID | 271 | 317 | 179 |

February 29, 2024
Positive tests for all three diseases, based on the numbers posted today, are down, a lot, for RSV and COVID, but up for Flu.
[Note: The chart below has two columns for the number for the week of February 17. I do this because the numbers first posted change when that week's numbers are updated in the next week's graph. So, when first posted, the February 17 RSV positive cases was 55. This week, the chart shows the February 17 RSV cases as 57. I understand that after they post each week, they get new numbers for that week and so they make corrections. There are a couple of problems:
- They don't clearly tell us they do this. I say clearly just in case they do somewhere that I haven't seen.
- When you look at each week's chart, the average citizen, doesn't know that last week's numbers have been updated from what it said last week, so
- When they look to see if cases have gone up or down,
- They don't realize the original numbers for last week's numbers were lower and
- That this week's numbers will be higher next week which could change whether cases went up or down.
| 2/17/24 as of 2/25/23 |
2/17/24 as of 2/29/24 |
2/24/24 as of 2/29/24 |
|
|---|---|---|---|
| RSV | 55 | 57 | 37 |
| Flu | 213 | 258 | 266 |
| COVID | 271 | 403 | 271 |
Here's a link to the chart below. It's interactive. Put the cursor on a column and it will give you the number of cases for each disease. But remember, it changes weekly.

February 25, 2024
I'm a little behind on this week's numbers. They're all down, but let's look at the details, remembering the numbers they posted this week will most likely be updated next week.
| 2/10/24 as of 2/16/24 | 2/10/24 as of 2/25/24 | Feb 17, 2024 posted @ 2/20/24* | ||
|---|---|---|---|---|
| RSV | 74 | 73 | 55 | |
| Flu | 243 | 254 | 215 | |
| COVID | 542 | 590 | 380 |
*I'm not sure what date they actually posted these because I wasn't checking daily last week. I saw them first yesterday(2/24/24)

The Alaska COVID numbers are down significantly this week (though watch for the 2/17/2024 total to be higher in next week's chart). But these are only the cases reported to the State. And 380 people breathing on unmasked people in their orbit can cause lots of more infections.
From the John Snow Project
Writing in Science, Ziyad Al-Aly and Eric Topol say:
“SARS-CoV-2 infection increases the risk of a wide array of chronic diseases and will contribute to a rise in the burden of cardiovascular disease, diabetes, neurologic impairment, and autoimmune conditions. This will increase demand on health systems and raise health care costs, and their impact may take many years to fully manifest. Long Covid affects the development and educational attainment of children and reduces labor participation and economic productivity in working-age adults. Both the direct effect of increased risk of death in people with Long Covid and the indirect effect on mortality through increased burden of chronic diseases caused by SARS-CoV-2 (e.g., cardiovascular, metabolic, and neurologic diseases) may contribute to further decline in life expectancy, potentially erasing decades of progress. Addressing these challenges will require continued focus on strengthening prevention efforts and urgently finding treatments for Long Covid.”
February 16, 2024
February 10 numbers: RSV based on last week's posted numbers, it's up one case. But last week's numbers were updated today from 73 to 78, so by those numbers it's down four. But will next week's number show it was really up this week?
Flu was up by both sets of Feb. 3 numbers - posted last week (182) and revised this week (212) to a new total of 243. That number posted today will probably be higher next week.
COVID was down from both Feb 3 numbers (595 posted last week and 641 posted this week) to 542.
Remember masks are good for all three: RSV, Flu, and COVID.
I know this gets confusing. The chart up today shows each week since August 5, 2023. But each new charts has different numbers for the previous week than it did when it was first published. That's not nefarious, I don't think. It's just that more numbers come in after they are posted. BUT, looking at the chart each week, you would never know that. And these adjustments show up each week. If there is someplace where all these adjustments are shown, I haven't found it. (And I haven't spent a lot of time looking for it.)
But scrolling through here, you can see those weekly adjustments. It just takes a bit of doing. But if anyone wants to figure out how much of an adjustment there is each week, the raw numbers are here.
| 2/3/24 as of 2/10/24 | 2/3/24 as of 2/16/24 | Feb 10, 2024 posted 2/16/24 | |
|---|---|---|---|
| RSV | 73 | 78 | 74 |
| Flu | 182 | 212 | 243 |
| COVID | 595 | 641 | 542 |

February 7, 2024 -
New numbers up today for February 3, 2024 show: RSV up 2 cases; Flu down 79 cases; COVID down 92 cases.
But also check how the original cases for Jan 27 reported on Jan 31 were significantly lower than what was reported this week (Feb 7, 2024). Each current week's number increases by the second week it shows up on the graph.
To be really clear, these are increases from one week to the next. Rather they are increases for the SAME WEEK as reported for the first time and then updated by the next report.
RSV went from 59 to 71 (up 25%)
Flu as reported went up from 245 to 261 (up 16%)
COVID reported went up from 622 to 687 (9.5%)
So, take this week's numbers with a grain of salt. Next week they are likely to be somewhere between 10 and 25% higher than they are now.
| 1/27/24 as of 1/31/24 | 1/27/24 as of 2/07/24 | Feb 3, 2024 posted 2/07/24 | ||
|---|---|---|---|---|
| RSV | 59 | 71 | 73 | |
| Flu | 245 | 261 | 183 | |
| COVID | 622 | 687 | 595 |

January 31, 2024 - The January 27, 2024 numbers are up. RSV and COVID down slightly and Flu up. But they are down from the updated numbers of Jan 20 (which are different from what was posted for that date last week) and next week the corrected numbers for Jan 27 could well be up.
Generally these graphs show an uptick. COVID has been above 600 for the last four weeks. Look at the curves separately for each color. Early November flu was at its highest, RSV and COVID were low.
| 1/20/24 as of 1/24/24 | 1/20/24 as of 1/31/2 | Jan 27, 2024 posted 1/31/24 | ||
|---|---|---|---|---|
| RSV | 71 | 74 | 59 | |
| Flu | 169 | 199 | 245 | |
| COVID | 565 | 652 | 622 |

About the newest variant JN.1:
"The World Health Organization (WHO) has declared it a “variant of interest.” There is no evidence that JN.1 causes more severe disease, the CDC says, but its rapid spread suggests it is either more transmissible or better at evading the immune system than other circulating variants."
As long as we stop taking precautions - on the belief that we're vaccinated and aren't likely to die - we allow COVID to find hosts in which it can mutate into more serious strains.
January 23, 2024 - The January 20 numbers are up today. RSV and COVID are down and Flu is up. Below I have two sets of numbers for 1/13/24 - what was posted last time (1/18) and the revised numbers posted this week. Remember, COVID numbers are low because people don't report their home test results.
| 1/13.24 as of 1/18/24 | 1/13.24 as of 1/24/24 | Jan 20, 2024 posted 1/24/24 | ||
|---|---|---|---|---|
| RSV | 70 | 85 | 71 | |
| Flu | 102 | 129 | 169 | |
| COVID | 599 | 662 | 565 | |

January 18, 2024 - Two weeks again. Or maybe I'm getting confused. I think there was one with January 6, but I guess I thought I'd done that one. In any case, here are the new numbers today.
Flu's gone up slightly, but RSV and COVID have gone down.
| 12/30 as of 1/5/24 | 12/30 as of 1/18/24 | Jan 6 as of 1/18/24 | Jan 13 posted 1/18/23 | |
|---|---|---|---|---|
| RSV | 92 | 98 | 82 | 70 |
| Flu | 67 | 100 | 100 | 102 |
| COVID | 357 | 460 | 705 | 599 |
January 5, 2024 - Today we got two weeks at once.
Basically RSV and flu have gone down each week and COVID has gone up each week. This reflects increases in COVID in much of the US. There's also an increase in Long COVID deaths nationally. Not sure it's an increase, or just growing awareness as officials are monitoring Long COVID victims. Compared to the overall number of deaths (over 1 million) from COVID, they're only reporting 5000 from Long COVID. Alaska isn't reporting deaths on their Respiratory Disease page. It would also be interesting to know how many likely Trump and Biden voters died or got very sick. Telling your supporters deadly lies doesn't seem like a winning tactic.
| 12/16 as of 12/16/23 |
12/16 as of 1/5/24 |
Dec.23 posted 1/5/23 |
Dec 30 posted 1/5/23 |
|
|---|---|---|---|---|
| RSV | 62 | 106 | 99 | 93 |
| Flu | 70 | 96 | 91 | 67 |
| COVID | 235 | 258 | 337 | 357 |

December 28 (and 29), 2023 - The new numbers aren't up yet. It's the week between Christmas and New Year, so I get it. But we have a governor who is doing his best to cut the budgets of most agencies except the ones that work on resource development, and the part of the law department that files amicus briefs for far right legal challenges. Meanwhile, respiratory diseases reports are going up in the rest of the country. Jan 3&4, 2024 still not updated yet. Called and left a message asking what was up.
December 21, 2023 - Big jump for COVID. Flu down sharply. RSV up a bit. New numbers are up today for Dec. 16. Again, last week's numbers have been updated - up a lot - and Dec. 16 numbers for RSV and COVID are up, while flu is down.
RSV - Dec 9 reported last week - 42; Dec 9 reported this week - 60; Dec 16 reported - 62
Flu - Dec 9 reported last week - 104; Dec 9 reported this week - 135; Dec 16 reported - 70
COVID - Dec 9 reported last week - 164; Dec 9 reported this week - 188; Dec. 16 reported - 235
 |
| Link to State Page with this graph interactive |
COVID is the highest it's been since October 28 when 240 cases were reported.
December 15, 2023
December 9 numbers are posted. Down, down, down. The numbers compared to last week are down. But the Dec 2 numbers reported last week, on this week's chart, are up, up, up
RSV - Dec. 2 reported last week- 42; Dec. 2 reported this week- 44; Dec. 9 reported - 42
Flu - Dec. 2 reported last week - 142; Dec 2 reported this week - 186; Dec. 9 reported - 104
COVID - Dec. 2 reported last week - 171; Dec. 2 reported this week - 181; Dec. 9 reported - 164

From the CDC yesterday (Dec. 14, 2023)
"The Centers for Disease Control and Prevention (CDC) is issuing this Health Alert Network (HAN) Health Advisory to alert healthcare providers to low vaccination rates against influenza, COVID-19, and RSV (respiratory syncytial virus). Low vaccination rates, coupled with ongoing increases in national and international respiratory disease activity caused by multiple pathogens, including influenza viruses, SARS-CoV-2 (the virus that causes COVID-19), and RSV, could lead to more severe disease and increased healthcare capacity strain in the coming weeks. . ."
December 7, 2023
The December 2 numbers are up now.
RSV - no change: 42 listed now as Nov 25 number (it was 40 when it was originally* posted) and 42 now
Flu - big drop. 239 listed now as Nov 25 number (it was 218 when originally posted) now 144
COVID - Big rise. 118 listed now as Nov 25 number (same as original posting) now 171

*Each column has a date. If you put your cursor over the column (in the original, not the image above) you get the numbers. The numbers for a particular date when originally posted by the state may change the next week. I'm looking at the previous week's most recent numbers compared to the numbers when it was first posted. I'm not looking back further. I assume they are simply adding additional cases that get reported late. But I don't know that for sure.
November 30, 2023
The November 25 update came out. The numbers for the Nov. 18 column for RSV and Flu are the same as they were last week. But the COVID number originally published was 157 and today that Nov 18 number is 161.
- This week RSV cases went up from last week's 39 to this week's 40.
- This week's flu number dropped from last week's 299 to this week's 238.
- This week's COVID number dropped from last week's 161 (updated this week from 157 originally reported) to 118.

November 22, 2023
The dates for the columns are for Saturdays, but November 18, 2023 only showed up today (Wednesday). For Alaska the numbers for flu is down a lot, COVID is down a bit, RSV is up.
But I'd also note that the Nov 11 numbers listed on the Nov 18 chart (you have to go to the site and put your cursor over the column) are different from what they were when it was originally posted. Even the Nov 4 numbers are different from the previous two charts. It would be nice to track how often and how large the changes are to previous charts, but I'm only going to look at the current and previous weeks. But all these changes do affect our sense of how much change there is from week to week.
Nov 11, 2023 RSV Flu COVID
Original #s 22 475 179
This week 22 597 157
My assumption is that the latest numbers reflect late arriving data.

Using the data for Nov 11 on this week's chart:
- RSV is up 16 cases from 22 to 38
- Flu is down 249 cases from 537 to 289
- COVID is down 6 from 157 to 151.
November 16, 2023
I've been checking for updates. There's a new one up today (or maybe it was up yesterday), dated Nov 11, 2023. The good news is that all three categories improved.
But first, the adjustments. The Nov 4 chart (originally posted) showed 23 RSV, 729 flu, and 231 COVID. If you hover over the Nov 4 column this week (which I don't show in the chart below but you can do here - at least until they change it next report) you get 24 RSV, 729 flu, and 271 COVID. I'm still scratching my head, figuring out how to most clearly show the changes reported in the original charts and in the next reported charts. The numbers change, but the State doesn't really tell us they've made adjustments. (Well, maybe somewhere in their explanations they do, but I haven't found it.)
So how do I report the changes since last week? Based on the updated numbers? Or based on the numbers reported last week? I'm going to do it based on the updated numbers, because I assume those more accurately reflect data that came in late. You can do your own calculations based on the update I made last week.
With that caveat, RSV dropped from 24 reported cases to 22. (Apparently, based on comments on the site, mostly in Juneau.) Flu dropped significantly from 729 to 475 reported cases. COVID dropped from 271 to 179 reported cases.
The state website has a lot more detail. You can look at regional numbers and written explanations.

November 10, 2023
Below is the November 4 chart. But it wasn't up when I looked for it on November 7, 2023.
When you put the cursor on the column those little charts with the number pop up. I cut and pasted the Oct. 28 numbers onto this chart.
The weekly changes, as depicted on this chart, were:
RSV up from 10 cases to 23; Flu up from 599 cases to 726; COVID down from 285 to 231 cases.

But if you compare the numbers that were originally posted with the October 28 chart (compared to the October 28 column on the Nov 4 chart) the numbers were slightly different.
RSV was 10 on both charts.
Flu was 584 on the original chart and 599 on the updated chart.
COVID was 299 on the original chart and 285 on the updated chart.
The October 28, 2023 Chart

The October 14 Chart

No comments:
Post a Comment
Comments will be reviewed, not for content (except ads), but for style. Comments with personal insults, rambling tirades, and significant repetition will be deleted. Ads disguised as comments, unless closely related to the post and of value to readers (my call) will be deleted. Click here to learn to put links in your comment.