Showing posts with label numbers. Show all posts

Wednesday, September 01, 2021

Alaska's Dismal COVID Data

 I track Alaska's COVID numbers on a chart I started March 15, 2020.  I also make a small summary of the numbers each day.  That got too tedious to post here with the regular posts every day, so they're hidden in a tab under the banner above: Alaska Daily COVID Count 3.

The numbers continue to get worse and worse.  Normally I keep the comments to a minimum and focus on the numbers.  But I couldn't help myself today.  This is all so avoidable, but the kids in the third grade classroom who still haven't learned to clean up after themselves and can't stand it when another kid has something that don't have (even if they don't even want it), well those kids (and their various enablers) are keeping this pandemic going.  

Here's today's update. You have to actually go to the tab to see the table with all the numbers.  

"Wednesday, September 1, 2021 -  For all the folks complaining about how Biden got us out of Afghanistan, yet didn't really work hard to get past the 20 years of wishful thinking about how well the Afghan army and government were doing, think carefully about your beliefs that COVID is a hoax, that herd immunity will make it disappear, that younger people don't get sick or die, that masks and vaccines don't matter.  You're thinking like those so focused on myths about American exceptionalism and our ability to make anything happen because ... we are America.  The Alaska numbers are worse once again and it's the fault of a Governor who cares more about his agenda of cutting government and getting reelected than about the lives of Alaskans.  It's the fault of people profiting from slick podcasts and websites that spread misinformation and alternative medicines that range from useless too dangerous.  It's the fault of people so vested in some mythical better time in America that they believe anything that supports their false vision.  

Sorry, but four more people died yesterday.  That's adding to the four who died the day before.  13 more were hospitalized.  Another new record of COVID hospitalizations was set: 181 or 161(20) - the (20) are COVID positive or suspected who are on Vents.  That sounds like nothing, but  BEING ON A VENT IS HORRIBLE!  This is from Yale Medicine

"The goal is for patients to be awake and calm while they are on a ventilator, but that can sometimes be difficult; many require light sedation for comfort, Dr. Ferrante says.

“Sometimes, patients develop delirium, or an acute state of confusion. And when patients become confused, they might try to pull out their endotracheal tube, which connects them to the ventilator,” she says. “Patients with delirium can be lucid one moment and confused the next. Although we try to avoid sedation as much as possible, particularly in delirious patients, we may have to give some sedation to prevent people from causing self-harm, like pulling out the breathing tube.”

Furthermore, patients with ARDS often feel a natural instinct to take in very big breaths, Dr. Ferrante adds. “Very large breaths can be harmful to an ARDS patient’s lungs, so we try to have their breath size match what we have set on the ventilator,” she says. 

Typically, most patients on a ventilator are somewhere between awake and lightly sedated. However, Dr. Ferrante notes that ARDS patients in the ICU with COVID-19 may need more heavy sedation so they can protect their lungs, allowing them to heal."

Here's another description from the Medical School at Ohio State University.

22 available ICU beds in Alaska, six in Anchorage.  That's a slight improvement, thanks, I guess to the four people who died.  

761/765 new resident cases. Yet another one day record for 2021.  Not the kind of records we want.  Also, 37 new non resident cases.

About 11,000 tests.  Test Positivity dipped slightly.  Yesterday was the highest TP of 2021 and today is the second highest at 7.47.  You can't fly on this 747 though.  

And with Matsu having the 3rd worst Alaska vaccine record at 44%  (one or more shots) yet hosting the State Fair and trying to open schools without masks, be assured things are going to get worse before they get better."

Folks, it's probably not people who read this blogs.  But people you know are insuring that more people get sick and die of COVID.  It's a shrinking minority.  

63% of US adults (18+) are fully vaccinated.  That means 37% of adults are not.  63%-37% is a landslide in an election.  

55% of Alaskan (12+ not 18+) are fully vaccinated.  That means 45% are not.  But this includes kids from 12 to 18, not just adults over 18.  55% to 45% is still a pretty decisive win in an election.  If you interact with non-vaxxers, be polite.  Ask them about their family life when they were kids.  How well did the siblings get along?  How did they get along with their parents?  I suspect for many of them, that is the crux.  They're still rebelling against parental authority.  Whatever they are told by their parental authority substitute, they'll do the opposite.

Wednesday, August 18, 2021

Alaska COVID 2021 Highs And Some Vaccine Numbers

 Today's COVID tab entry:

Wednesday, August 18,2021 - Four new deaths reported today.  That's nine in the last two days.

Current COVID patients hospitalized 148 - that's 127 listed as 'Currently Hospitalized - COVID positive" and 21 more listed as 'Currently On Vent Statewide - COVID Positive or Suspected'.  Or, as I've been reporting 127/21.  That's an increase of one person since yesterday.  The cases dashboard says there are 13 newly hospitalized people.  That sounds about right - four people died and a few others maybe got better and left the hospital.  

28 available ICU beds Statewide.  Three in Anchorage!

633/617 new resident cases.  That's a new 2021 high for one day and the highest since Dec. 10, 2021.  The Cases Dashboard changed.  Instead of 'resident' and 'non-resident' options, we now get 'resident' and 'all' options.  But I couldn't get the all button to get me different data from 'resident' data.  Not sure why they thought this was a better idea.  Every time you change how you organize the data, you making tracking and comparisons harder.  So there has to be a really compelling reason.  And if you change the Dashboard, but it doesn't actually work . . .

About 10,500 tests.  Test Positivity is up to 7.43.  Another 2021 high.  Hasn't been this high since November 23, 2020 when it was 8.13.  

If you get to talk - not shout - with an anti-vaxxer, just ask when their relationship with their parents changed from parent/child to friend/friend.  

 These COVID updates don't usually show up in the main window.  They're at a tab under the top banner. Alaska Daily COVID-19 Count 3  I'm putting this one in here because Alaska's COVID situation continues to deteriorate.  Here's some added info on vaccination rate.

Last week- August 11, 2021:


The Key Numbers As Of August 18, 2021
# of people who have two vaccines shots in Alaska: 324,635.
That's in increase of 3,101 since last week (Aug 11)
# of people who have had one vaccine shot in Alaska: 36,519
That's an increase of 1,320 since last week.

It took Alaska four and a half months to get 50% of population with one or more shots.

It's taken three months to get the next 8%


And here's today's (August 18, 2021).  

In one week we have gone from from 58.8% with one or more shots to 59.5%.  From  356,823 people to 361,154 or a total increase of 4,669.

From 53% with two shots to 53.5%.  321,534 people to 324,635, or a total of 3,101 increase.

Remember, that the first number is people with one + shots.  So it includes all the people with one AND all the people with two shots.  To find out how many only had one shot, we subtract the two shots number from the one+ shots.

Last week: 356,823 - 321,534 = 35,289 people with just one shot

This week:  361,154 - 324,635 =  36,519 people with just one shot   

That would mean 1320 people got their first shots in the last week and 3,101 got their second shots


Looking at the graph on the bottom of this week's chart, I highlighted as close as I could get to 50% - (50.3%) on May 13, 2021.  

So, it took Alaskans about four and a half months to get to 50% with one or more shots.
And it's taken three more months to go another 9%!

I understand there are people who believe that the vaccine doesn't work, that it injects God knows what into their bodies.  There are people who make lots of money off of conning people into fearing the vaccines.  Those people who didn't vote in Anchorage's mayoral runoff election helped to vote an anti-masker/anti-vaccine guy into office.  Even though over 50% of people over 12 have been vaccinated twice.  People - you have to vote or we get crazies elected to make decisions for us.  

On a more positive note, I reached Nakorn Sawan the other day and have about 130 km left to get to Bangkok.  (No, I'm not in Thailand.  I'm doing this imaginary ride on the bike trails of Anchorage.  It looks like I'll make the 750 kms in plenty of time.  I can't tell people how wonderful it is to ride through the woods with creeks on one side several times a week.  I may have to do a short side trip after I'm done to keep me going until the snow falls.  

Tuesday, August 17, 2021

Alaska Redistricting Board Calculates District Gains and Losses - Precint By Precinct

I don't totally understand this yet, but I thought it important to get this email from the Alaska Redistricting Board up for people to see.  (If you sign up with the Board, they will send you updates like this.)

They got the initial data and the staff have been trying to organize it.  You can see all the districts here on the Board's website.

It should come as no surprise that Matsu has the biggest gains.   Here's District 1 in Fairbanks. The cooler colors represent losses of population.  The warmer colors gains.

Population Change

This table compares Alaska's 2010 to 2020 Census population count at the voting precinct level.
Click column heads to sort. Click again to reverse sort order. Monochrome

DistrictPrec.Name  2010  2020DiffChange
District 1 ~ Fairbanks ~ Map: HD01-A.pdf 
1 (A)446Aurora2,995 3,108 113 +3.77%
1 (A)475Fairbanks No. 41,143 993 -150 -13.12%
1 (A)485Fairbanks No. 62,483 2,390 -93 -3.75%
1 (A)470Fairbanks No. 31,872 1,872 0.00%
1 (A)465Fairbanks No. 21,542 1,468 -74 -4.80%
1 (A)455Fairbanks No. 1659 580 -79 -11.99%
1 (A)490Fairbanks No. 73,010 2,637 -373 -12.39%
1 (A)480Fairbanks No. 52,885 2,668 -217 -7.52%
1 (A)495Fairbanks No. 101,137 1,466 329 +28.94%
–– > 9 PsDistrict: 1 Totals:17,726 17,182-544-3.07%


"Good afternoon subscribers,


After many hours of data crunching, we have a couple of key reports available for your review. These are:  
  1. A table of population changes from 2010 to 2020 at the house district precinct level. This shows how each of Alaska's 441 precincts increased or decreased in population over the last 10 years. District totals are also provided. Click table heads to sort, click again to reverse sort order. Warm colors are up, cool colors are down. Click Monochrome if coloration is not preferred.
  2. A report of each house district's 2020 population compared to the new ideal district population of 18,335. (733,391 divided by 40). Click title heads to sort, click again to reverse sort order. Warm colors are high, cool colors are low. Click Monochrome if coloration is not preferred.
  3. An Excel sheet with the data for your computing convenience. Click to download. Available formats are .xlsx and .xls

Here's how we got to the numbers:

The Alaska Department of Labor imported the 2020 legacy-formatted Census data1 into their demographic software and sent us Excel reports of Alaska's 2010 and 2020 population for all of Alaska's 441 voting precincts. This is the foundation of our population change table.

To verify the 2020 numbers, we did the same thing independently. We downloaded the 2020 legacy data and loaded the lines2 which provide voting precinct counts into a relational database. We then overlayed the Department of Labor's 2020 precinct population numbers with ours.

Row-by-row, every precinct population matched exactly.


This is how a voting precinct total appears in the legacy-formatted Census data. (line 7,991, akgeo2020.pl)

To further validate our findings, next we totaled the precinct populations for each house district and compared these line-by-line with the house district summary population values contained elsewhere in the raw legacy data.

Once again, every value matched exactly.

This is how a house district total appears in legacy-formatted Census data. (line 4,496, akgeo2020.pl)

On April 26, the Census reported that the total resident state population was 733,391. When we total all 441 of our individual voting precincts the result is: 733,391. When we total all of our 40 house districts the result is: 733,391.

After these and other validation exercises, we conclude that the reports published on our website today faithfully interpret the findings of the 2020 Census. Of course, we will re-verify these numbers again using the fixed DVD media we expect to officially receive from the Census Bureau on September 30.

Have a great evening,

Peter Torkelson
Executive Director
Alaska Redistricting Board


1 – You may download the legacy-formatted data here:
https://www2.census.gov/programs-surveys/decennial/2020/data/01-Redistricting_File--PL_94-171/Alaska/

2 – See lines 7,989 - 8,444 of the legacy-formatted file titled 'akgeo2020.pl'. The precinct name appears three columns to the left of the population value. There are more than 441 lines used to report precinct populations as some precincts are reported in multiple parts, one part on each line.

3 – See lines 4,495 - 4,534 of the legacy-formatted file titled 'akgeo2020.pl'. The district name appears three columns to the left of the population value."

Saturday, August 07, 2021

Alaska Redistricting Board To Get Detailed Census Data August 12, 2021

 Here's the announcement from the Board's executive director:

". . . a quick note to let you know that we received notice a few minutes ago that the Census bureau will release legacy formatted redistricting data on Aug 12th at 9am Alaska time.

The previously published release date was August 16.

Our software vendor will need about a week to convert this legacy data into files that our map-drawing software can work with. We are working with the Department of Labor to get an early peek at the district population deviations and will advise you when these numbers are available for your review."

The State population arrived much earlier.  This is the detailed information needed to draw the district maps.  

I wrote about the public mapping software that will be available and the basic rule.    As the message says, it will take about a week for the data to be downloaded into the public map-drawing software.  I recommend getting familiar with the software.  This is like a free computer game with which you can help shape the Alaska legislature for the next ten years.  

Seriously.  If you can make demonstrably fairer maps - that is maps that meet the federal and state statutory requirements - than the Board makes, you could challenge their maps.  Minimally, you could share your maps with one of the interest groups that are following the process carefully.  This will include Municipalities, political parties, Native Corporations and non-profits, etc.  

You can go to the Board's website and start playing with the maps here (they have the data for the 2010 redistricting process loaded now.) I'm following my granddaughter's lead.  She just gets her mom's phone and tries out everything she can find until she figures out cool things she can do.  I'm trying to do that with the software.  

My understanding is that the Board has a month to prepare the first set of maps for public comment, so there should be a flurry of meetings soon.  There's no information yet about when that will start.  Not sure if it will take a week for Board's map-making software, or just for the public software.

Here's a screenshot.  I'm a little concerned about how easy this is going to be on my laptop.  We'll see.   So far it looks more like a toy, but let's see what I'll be able to do with it.  If there are mappers out there who want to work together on this, send me an email (upper right hand column) or leave comments.


Sunday, August 01, 2021

Not Learning From History. Not Knowing Statistics

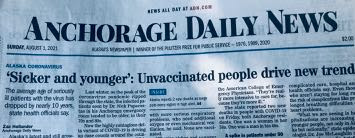
 The Anchorage Daily News headline today:


"Sicker and younger:  Unvaccinated people drive new trend"

I couldn't help but mentally edit  Pastor Martin Niemöller's famous quote about the Nazi's victims.

First they [it] came for the socialists [nursing home residents], and I did not speak out—because I was not a socialist.[a nursing home resident]
Then they [it] came for the trade unionists, [other seniors and immuno-compromised] and I did not speak out— because I was not a trade unionist.  [a senior or immune-compromised]
Then they [it] came for the Jews,[unvaccinated] and I did not speak out—because I was not a Jew. young
Then they [it] came for me—and there was no one left to speak for me.

A major problem driving all this is STATISTICAL IGNORANCE.  People simply don't understand statistics, so terms like 'flattening the curve' or 'cases per 100,000' don't really mean anything.  The graphs are just pictures of curves and straight lines.  

And newspaper headlines and Tweets don't help.  Either the writers and editors don't understand statistics or they are intentionally trying to mislead.  (Sure, it's rarely either/or, they might just be rushing and not thinking)


Do I need to explain these Tweets?  Yeah, I guess, some folks won't get this.  

The original tweet (Ken Dilanian) highlights that 125,000 fully vaccinated Americans tested positive for COVID.  There's no mention of: 
  1. what the time period was
  2. how many of them were asymptomatic
  3. how many had minor symptoms
  4. how many were hospitalize
  5. how many needed a ventilator
  6. how many died
And Derek Willis also points out that if you realize that this was .08 percent of all the 164 million people who have been vaccinated, the amazing effectiveness of the vaccines are highlighted instead of making it sound like the vaccinations are ineffective.  

One last thing that I've mentioned before, but isn't talked about enough.  The longer the virus is able to find refuge in human hosts, the more potentially deadlier and more contagious variants can evolve.  (And you have to understand and believe in evolution to understand that point.)  So, the more people who are vaccinated (locally, but also world wide, cause people travel and virus hitchhike on those travelers) the fewer refuges there are for virus to mutate.  


It seems to me we're all in a leaky boat together in the ocean.  The water is up to our ankles.  A small but vocal group of the passengers want to drill holes in the bottom of the boat to let the water drain out.  Those are the anti-maskers and the anti-vaxxers.  


Wednesday, July 21, 2021

Anchorage Assembly Have Mid-Day Work Session on Homeless Issues

 I went to the Assembly Homeless Public Hearing today.  There were about 40 people in the audience and about 25% were wearing masks most of the time.  

Let me  highlight what I took away from the meeting.  These were the three issues that seemed to be problems that were raised for the Assembly to try to resolve or at least understand.

  • Measurement - HMIS (Homeless Management Information System)  - They've come a long way since I took the Olé 8 week homeless class.  To plan for the future they have to count the homeless.  They have to be able to identify the different kinds of homeless - those who have lost a job or had overwhelming medical expenses;  those who are working but don't earn enough; those who are chronically homeless, perhaps addicted or mentally ill or badly physically disabled.  Several people mentioned a man with no hands who is homeless.
Click on Image to Enlarge
Then there is the issue of tracking these individuals.  This chart tells us that most of the agencies dealing with the homeless are now inputing information.  But COVID meant HUD required additional data and the work of inputting it all is becoming a problem and all that additional info is making the system harder to use.  But they also said that Anchorage has been cited as the location with the most complete data base tracking of homeless.  

These aren't problems unique to this data base.  Competing interests for which data to include, how to integrate the data, and usefulness to end users are always problematic.  And the more you add the slower it all gets and harder to use.  

Again, click to enlarge

  • Obstacles Homeless People Face Getting Service 
    • One speaker mentioned that people get to her agency with complaints of not being helped by other agencies.  An Assembly members asked why the others couldn't help.  The answer was:  Different agencies have different grants which often restrict who they can serve - maybe women with children, youth, long term homeless, disabled.  Or they are funded to provide a specific service.  
    • The data base is supposed to help coordinate these kinds of problems, but, as I understood it, it's easier to find programs than to track individuals as they use services of different programs
  • Problems Getting Appropriated Funding To Service Providers
    • The Assembly has appropriated monies for different agencies, but the process of actually getting the money to them is slowed down by federal requirements.  The slide below was put up in part response to this question, but I don't see that it addresses the issue in detail

A number of agency heads or high level employees answered questions from the Assembly.  


Jasmine Boyle is the Executive Director of the Anchorage Homeless Coalition.  When I took the homeless class we heard her name often and she was scheduled to talk to the class several times, but there were always crises that came up and I never got to see her before today.  


Lisa  Sauder is the Executive Director of Bean's Cafe.


[Sorry, I was sitting on the left and got only profiles.]

There were slides that showed numbers of homeless in recent years in summer and winter.  There were predictions of the numbers of beds needed this winter.  Most of the slides about how many homeless at the meeting are at this url.

But I left sort of scratching my head.  What was the goal of this meeting?  Was it for the Assembly to get information?  Most of this they should already have.  Was it a public education meeting?  There wasn't much public there.  (Maybe it was televised, I didn't check.)  For me the three bullet points above seemed to be the things the Assembly members found most helpful - the measurement issues, the obstacles to getting service, and the hold up of the appropriated money getting to the service agencies.  

But the critical issues - what's going to happen when the federal funds to keep Sullivan Arena open as a homeless shelter end in August? - well I didn't see much progress toward answering that question.  

Tuesday, July 20, 2021

GAMERS ALERT: Free Online Redistricting Mapping Software Let's You Help Shape Alaska's House And Senate Districts [Updated]

An email [it's copied below] for Alaska Redistricting Board update subscribers today says that they have worked out an agreement with Tufts University for maps making tools for the public to use.  [You can subscribe to the Board's updates here.]

The 2020 detailed census data are not out yet, but people can start practicing with the 2010 data now. Below is the email with a link to the software and two example maps.  

I haven't tried this yet because I wanted to get it out to people immediately.  For anyone interested in mapmaking or in politics, this is a must.  It's a good opportunity to get non-political tech people paired up with non-tech political people.  

I hope gamers see this as a real life game and that they can keep the Redistricting Board accountable by showing them that better maps (maps that meet all the Federal and State requirements more efficiently and equitably) can be made.  When there were challenges to the Redistricting Board's maps in the 2010 round, maps were submitted to the courts to show that better maps could be made.


As I looked at the example maps below I realized there are some requirements for valid districts that mappers need to know. Here's an early post from the 2010 Redistricting round that details some of the Federal and State requirements.  For instance, 

The Federal Constitutional Redistricting Principles are, briefly:
  • A.  "One Person, One Vote". . ."legislative seats must be apportioned exclusively on the basis of population and the populations of the respective districts must be substantially equal."
  • B.  "Districts of as nearly as equal size as practicable.  Maximum overall deviation of the no more than 10%, (i.e. plus or minus 5%)  Deviation is the measure of how much a district or plan varies from the ideal.  Good faith efforts to make deviations as small as practicable must be made. 

There are forty House seats.  Each has to be as close to equal as possible.  

The official 2020 total Alaska population which is  733,391 divided by 40 = 18,334.775.  

But it's impossible to have a fraction of people in every district, so it's necessary to have some deviance.  .  Ideally, each district deviates from 18,335 by less than 1% (That would be 183 people). 

But while mappers have to get all the districts equal, they also have requirements for compactness and for "relatively socio-economically integrated areas"   That's why some districts can deviate up to 10%, though that is discouraged.  Urban districts with lots of population should be under 1% deviation if possible.

So here's an enlargement of the first map below.  It's pointing to "percentage of deviation from the ideal"  That should make sense to you now, but let me repeat the details again.

Population Balance refers to the fact that every House district has to be as close to 1/40 (there are 40 house districts) of the official 2020 total Alaska population which is  733,391 divided by 40 = 18,335.  

I'm confused by the numbers in the red circle.  It says percentage, and 8.860 percent is under 10%.  But I don't know why it has a comma instead of a period.  I have an email into the Board to clarify that.  It could just be the way that software handles percentages.  I'll update this when I hear back. [UPDATE July 22, 2021:  Yes these are numbers and if I had read the note more carefully, I would have realized you need to hove the cursor over the numbers to get the percentage of deviation.]

Now, here's the email:
"Good morning subscribers,

Thanks for your continued interest in Alaska’s redistricting process. Census data for 2020 is expected in late August and the Board is looking forward to getting to work.  Drawing maps will be challenging and public feedback is an essential part of the process. 
 
One of the ways you can provide input is by sending the Board your map ideas. To facilitate this the Board is working with The Redistricting Lab at Tufts University to deploy a customized, web-based, publicly available map drawing tool.  This platform is available now for your beta testing at: 


REMINDER: the data and blocks shown are from the 2010 Census; the 2020 data will be uploaded in late August – we’ll send out a notice at that time. Any maps you create until then will be based on 2010 population data and so are not appropriate for formal submission to the Board.

The web mapping tool uses a "paint brush" concept (for coloring) to shade in areas you wish to assign to a district, which are denoted by 40 individual colors.  This customized version allows painting at the Census block level, the most precise level of geography available and the same one which the Board will use to draw new legislative districts.

As you "paint" a district, the population will be dynamically totaled under the Population tab.  To assist you, under the Data Layers tab you'll find tools to overlay the state with existing legislative district boundaries, incorporated city limits, borough boundaries and school districts.

If you would like to view population distribution you may make selections to shade Census blocks with population density under Data Layers -> Demographics -> Population.

The system supports undo/redo, and allows you to "lock already drawn districts". This enables drawing perfectly adjoining districts by respecting blocks you have already colored into a previous district.

Use the Save/Update button to save your work, share plans with others (copy and send the URL) or submit directly through the website for Board consideration (once we have gone live with 2020 data, expected at the end of August).

Please take a little time to experiment with the tool so we can identify any bugs prior to our public launch. Your feedback would be appreciated; simply reply to this email.

Thanks,

Peter Torkelson
Executive Director
Alaska Redistricting Board 

P.S.  Here are a few tool tips to get you started:"   [Below are the two example maps that were at the end of the email.  You can enlarge them considerably by clicking on them.]


Monday, April 26, 2021

Alaska Officially Has 733,391 People - According To The 2020 Census - UPDATED

Just got his email from Peter Torkelson, executive director of the Alaska Redistricting Board.  (You can subscribe to these email updates from the redistricting board here. 

"Good afternoon subscribers -- A few minutes ago the US Census announced the total population numbers for each state.  Alaska's official 2020 resident population is 733,391. This means the population target for new legislative districts will be 733,391/40 = 18,335."

Let's take that apart a bit.  Nothing more than 3rd grade arithmetic at most, I promise.  Alaska has forty state house seats.  The state senate is made up of pairings of those forty seats - that is two adjacent house seats make up one senate seat. 

Each house seat should have the same number of people in it as every other house seat.  Of course, that would be quite a feat.  So the goal is to make them within 1-2% of each other.  In cases where this just isn't possible, the absolute maximum difference is 10%.  (This is based on my memory from last year.  Once the Board gets these number broken down by census districts, the Board will get a lot busier and we'll get these details refreshed.)

So, if there are 40 districts that have to have equal population, you have to divide the total population by 40.  Which is what Peter has done to get 18,335 residents per district.  Actually, my calculator says it's 18,334.775.  Which does mean that it is truly impossible to get all the districts exactly equal.  And since the time they recorded everybody, people have moved out of the state or into the state and new people have been born and some people have died.  So the number is always in flux.

The magic number for each district based on the 2010 data was 17,755.  So each district this time will have 580 more people.  Theoretically.  

I'd add that this includes all Alaska residents, not just those of voting age, not even just US citizens, but all the people who live here.  

To put that in context, [see below] people have applied for Alaska Permanent Fund this year.  [I thought I was going to get that number from the PFD office in Juneau.  Chris transferred me to Corey, but he didn't answer the phone. (It is after 4pm now, though it wasn't when I started these calls.)  I'll add the number in when I get it]

[UPDATED 5pm:  Corey got back to me.  They are still entering paper applications into the system by hand.  As of this afternoon at 4:30pm, they have 643,117 applications and he expects 25-30,000 more.]

Meanwhile  here are the PFD's numbers for population and applications since 2020.


 Remember the magic number:  18,335

Saturday, February 13, 2021

Alaska Redistricting Board To Get Census Data "By Sept. 30, 2021" Along With All The Other States

The following notice comes from a US Census Bureau redistricting blog via an email from the Alaska Redistricting Board Executive Director Peter Torkelson.  (He offered to email a notice of the next Board meeting when I asked if there were an easier way to find out meeting times than the State Public Notice site.  Thanks, Peter.)

FEB. 12, 2021 — The U.S. Census Bureau announced today that it will deliver the Public Law 94-171 redistricting data to all states by Sept. 30, 2021. COVID-19-related delays and prioritizing the delivery of the apportionment results delayed the Census Bureau’s original plan to deliver the redistricting data to the states by March 31, 2021.

Different from previous censuses, the Census Bureau will deliver the data for all states at once, instead of on a flow basis. This change has been made because of COVID-19-related shifts in data collection and in the data processing schedule and it enables the Census Bureau to deliver complete and accurate redistricting data in a more timely fashion overall for the states.

The redistricting data includes counts of population by race, ethnicity (Hispanic or Latino origin), voting age, housing occupancy status, and group quarters population, all at the census block level. This is the information that states need to redraw or “redistrict” their legislative boundaries.

In preparation for the delivery of redistricting data products, the Census Bureau has been in close coordination with each states’ official nonpartisan liaisons to understand the impacts of the delayed delivery on individual states. Since 2019, states have had access to prototype geographic support products and data tabulations from the 2018 Census Test to help them begin to design their redistricting systems. This is one tool states can use to help minimize the impact of schedule delays. In addition, the Census Bureau today completed the release of all states’ 2020 Census geographic products needed for redistricting. This will enable states to redistrict promptly upon receipt of their 2020 Census tabulation data.


I'd note that this is a significant delay (potentially six months if it takes until September 30) from ten years ago when the Alaska Redistricting Board got its data from the US Census Bureau on March 15.  That post explains some of the rules at the time - like having to have the first plan done within 30 days of receiving the data.  (I apologize for the missing photos on that page.  They weren't mine and some are apparently no longer on the original sites.)  I don't know whether any laws have been changed since then.  Back then I learned about the rules because they were explained at the Board Meetings.  There have only been a few meetings this time round and they've all been COVID kosher.  

Saturday, November 07, 2020

Election Thoughts Post 1 - Why Did Biden Get Only 771,884 Votes When Kentucky Has 1.67 Million Registered Democrats? [UPDATED]

 I don't know the answer.  I don't know much about Kentucky at all.  But from far away it seems odd.  (Kathy in Kentucky, any insights you can share would be appreciated.  And, btw, it turns out my post on when states can count wasn't totally accurate. Kentucky wasn't last in vote counting.  Alaska, while legally allowed to count ballots starting after the polls closed, chose to wait a week to do so. Or maybe Kentucky just chucked all the mail-in votes.) [UPDATE Nov 8:  Be sure to see Kathy's comments below.  It answers a bunch of my questions.]


Biden got just 771,884 votes in Kentucky.

Here's the official vote tally from the LA Times:


And from the Kentucky election website, here are the numbers of registered voters.  There are 1.67 million Democratic voters. I cut it off so the numbers would be large enough to see here, but you can go see the original at the Kentucky website.


That means less than half the Democratic voters voted for Biden.  


Given that this is Senate Majority Leader Mitch McConnell's home state and he's shown he's willing to do anything to keep his seat and his majority to thwart Democrats since Obama was first elected, I think this ought to be looked into to be sure that there wasn't serious election irregularities.  

Newsweek reported in 2019:

"Senate Majority Leader Mitch McConnell squashed two bills intended to ensure voting security on Thursday, just one day after former special counsel Robert Mueller warned that Russians were attempting to sabotage the 2020 presidential elections "as we sit here."

McConnell said he wouldn't allow a vote on the bills because they were "so partisan," but, as previously reported, earlier this year McConnell received a slew of donations from four of the top voting machine lobbyists in the country."


Here's a longer New Yorker article entitled Mitch McConnell is Making the 2020 Election Open Season for Hackers

This post was in response to a Tweet that pointed out the numbers.

[Note:  There are so many things to write about on the election.  I'm resisting my natural tendency to try to integrate 20 different threads into one comprehensive post.  Instead I'll just post on relatively discreet topics.  I'll either let the reader pull them all together or maybe at the end I'll figure out a way to connect all the dots.]


Tuesday, October 20, 2020

I'm Not Really Being Lazy Just Because I Don't Have A New Post Everyday

 Because, actually, I do.  And sometimes two.  

Since I started tracking Alaska's COVID-19 cases, other posts aren't showing up so often.  I started just doing COVID-19 posts here, like this post.  But they were taking too much room and I was repeating the same charts over and over.  So I switched to a "Page" - a tab in Blogger jargon.  So now, unless you click on the tab above (just under the orange blog banner) it looks like I haven't done a new post.  


But in addition to updating the table with the day's new numbers, I do a brief summary as well.  Like this one from yesterday:

Monday, October 19, 2020 - Good signs, but not all good.  

Today was the second day in a row with no new deaths or new hospitalizations.  October 4 was the last time we had just one day with no deaths or hospitalizations.  We have to go back to September 14 and 15 for two days in a row like that.  And before that?  June 27-30 when there were four days with no deaths or hospitalizations.  This might just be a problem of not getting the hospitalization reports in over the weekend.  But it's a glimmer of hope.

There were 208/200 new resident cases.  It's four days in a row with 200 or more cases.  That has never happened before in Alaska.  Not so good.  The more cases, the more eventual hospitalizations and deaths to follow.

27 reported recoveries and 175 MORE active cases - for another all time high of 5235.

11,012 new tests, one of the highest totals. [10/20/20 -Had typo in chart yesterday.  Not sure how many new tests, yesterday.  The updated past numbers are totally different from what I documented daily.] We're at [5]33,723 tests total.  Our state population is about 730,000.  But this number is NOT how many Alaskans have been tested, but how many tests have been given.  Many essential workers get tested over and over again. 

The test positivity rate dropped slightly from 4.78 yesterday to 4.6 today.  Under 5.0 is good.  

The State keeps other numbers I don't keep track of on the chart above.  I've been reporting Reproductive Number in the daily reports lately.  Today down slightly to 1.07.  Under 1 is the goal.  We're close.

I haven't mentioned hospital capacity for a while, mainly because it hasn't been an issue.  But when I looked today, The hospitals are getting a little more crowded.

57% of adult beds are occupied.  There are 550 vacant.  That's for everything, not just COVID-19.

68% of adult ICU beds are occupied.  There are only 43 left.  Again, not just COVID-19 patients.

Ventilators aren't an issue at this point.  Only 9% being used with 324 left.  

There are 41 COVID-19 patients in hospital beds and 24 more suspected COVID-19 cases.  


What I'm learning is that the State's numbers are fluid.  That is they get adjusted as more info comes in - maybe some new cases turn out to be non-residents instead of residents, or a bunch of tests come in from several days ago.  I'm just doing each day's numbers and if anyone every wants to know how much the State's numbers have fluctuated, they can compare what the State has posted to what I have posted.  Though that won't show how often the State adjusted their numbers.  

We've been seeing about 200 new resident cases a day this last week or so and the number of active cases keeps going up because new cases outpace recovered cases.  Though recovered cases are one of the least up-to-date numbers they offer.  

On the positive side, our Test Positivity has only been over 5.0 a couple of times.  (5.0 is the target number set by the WHO.  And our Reproductive Number is only fractions above the target number to be below: 1.0.  

But with not much effort at all, the numbers could explode, and our hospitals could get overpacked.  

Anyway, just wanted to point out that this action is taking place a little hidden from sight in the tabs. There are two COVID tabs because the first one was getting really big.  It goes from June 1 to September 30. (Before that I was doing daily COVID-19  posts, which you can probably find most easily by looking at the Blog Archive (right had column) in March, April, and May.  The new tab started October 1.  

Stay well and if you must engage the anti-maskers do it gently and just listen, don't argue.  Ask questions if you have to say anything.  They have issues regarding power mostly, so telling them to do something pisses them off.  Like a rebelling teenager who will do the opposite of what you ask them to do.  These are chronological adults, but emotional teenagers.  (Yeah, that's a pretty broad generalization, but I suspect it's more accurate than not.)

Wednesday, May 06, 2020

Alaska COVID-19 Count Tuesday May 6, 2020 - 1 New Death, 1 New Case

We now have 10 Alaskans who've died of COVID-19.  This is the first new death in about 3 weeks.
There was also one new case.  You can see how things are changing in the charts below.

Meanwhile, my garden seems unaffected by COVID-19.  Things are popping up and we had a
surprise appearance of two daffodils.  Surprise because while I had seen the buds, the popped open even though the leaves are very high up yet.


Calendar Chart


CONFIRMED COVID-19 CASES ALASKA MARCH/APRIL/May 2020
MondayTuesdayWednesdayThursdayFridaySaturdaySunday
new/totalhos=hospital

12th  = 0/013th = 1/114th = 0/115th = 0/1
16th = 0/117th = 2/318th = 3/619th = 3/920th = 3/1221st= 2/1422nd= 8/22
23rd=14/3624th =6/42
1 hos 1 dead
25th = 17/59
3 hos 1 dead
26th = 10/69
3 hos 1 dead
27th =16/89
5 hos 2 dead
28th = 13/102
6 hos 2 dead
29th= 12/114
7 hos  3 dead
30th=5/119
7 hos 3 dead
31st= 14/133
9 hos 3 dead


April 2020

1st=  10/143
hos 3 dead
2nd=8(6)/149
13 hos 3 dead
3rd=8(11)157
15 hos 3 dead
4th=15/171
16 hos 5 dead
5th= 14/185
20 hos 6 dead
6th=6/191
23 hosp
6 dead
7th= 22/213
23 hosp 6 Dead29 recovered
8th= 13/226
27 hosp 7 dead
32 recovered
9th= 9/235
27 hosp 7 dead
49 recovered
10th=11/246
28 hosp 7 dead
55 recovered
11th=11/257
31 hosp 8 dead
63 recovered
12th= 15/272
31 hosp 8 dead
66 recovered
13th= 5/277
32 Hosp 8 dead
85 Recovered
14th = 8/285
32 Hosp 9 dead
98 Recovered
15th= 8/293
34 Hosp 9 dead
106 Recovered
16th= 7/300
35 hosp 9 dead
110 recovered
17th=  9/309
36 hosp 9 dead
128 recovered
18th =  5/315
36 hos 9 dead
147 Recovered
19th= 4/319
36 hos 9 dead
153Recovered
20th 2/321
36 hos 9 dead
161 recovered
21st 8/329
36 hos 9 dead
168 recovered
22nd  6/335
36 hos  dead
196recovered
23nd  2/337
36 hos  dead
209recovered
24th  2/339
36 hos  dead
208recovered (-1 from 4/23)
25th  0/339
36 hos  dead
217recovered
26th  2/341
36 hos  dead
217recovered
27th  4/345
37 hos  dead
218recovered
28th  6/351
37 hos  dead
228 recovered
29th  4/355
36 hos  dead
240recovered
30th  0/355
36 hos  dead
252recovered


May 2020


1st  9/364
36 hos  dead
254recovered
2nd  1/365
36 hos  dead
261recovered
3rd  3/368
36 hos  dead
262recovered
4th  2/370
37 hos  dead
263recovered
5th  1/371
38 hos  dead
277 recovered
6th  1/372
38 hos 10 dead
284recovered


State Charts


I've been making these screen shots high resolution so you can click on them to enlarge and focus.  But click here if you want to use the chart interactively, to play with the original and other charts they have.


Day-By-Day Chart